

English
Demand forecast
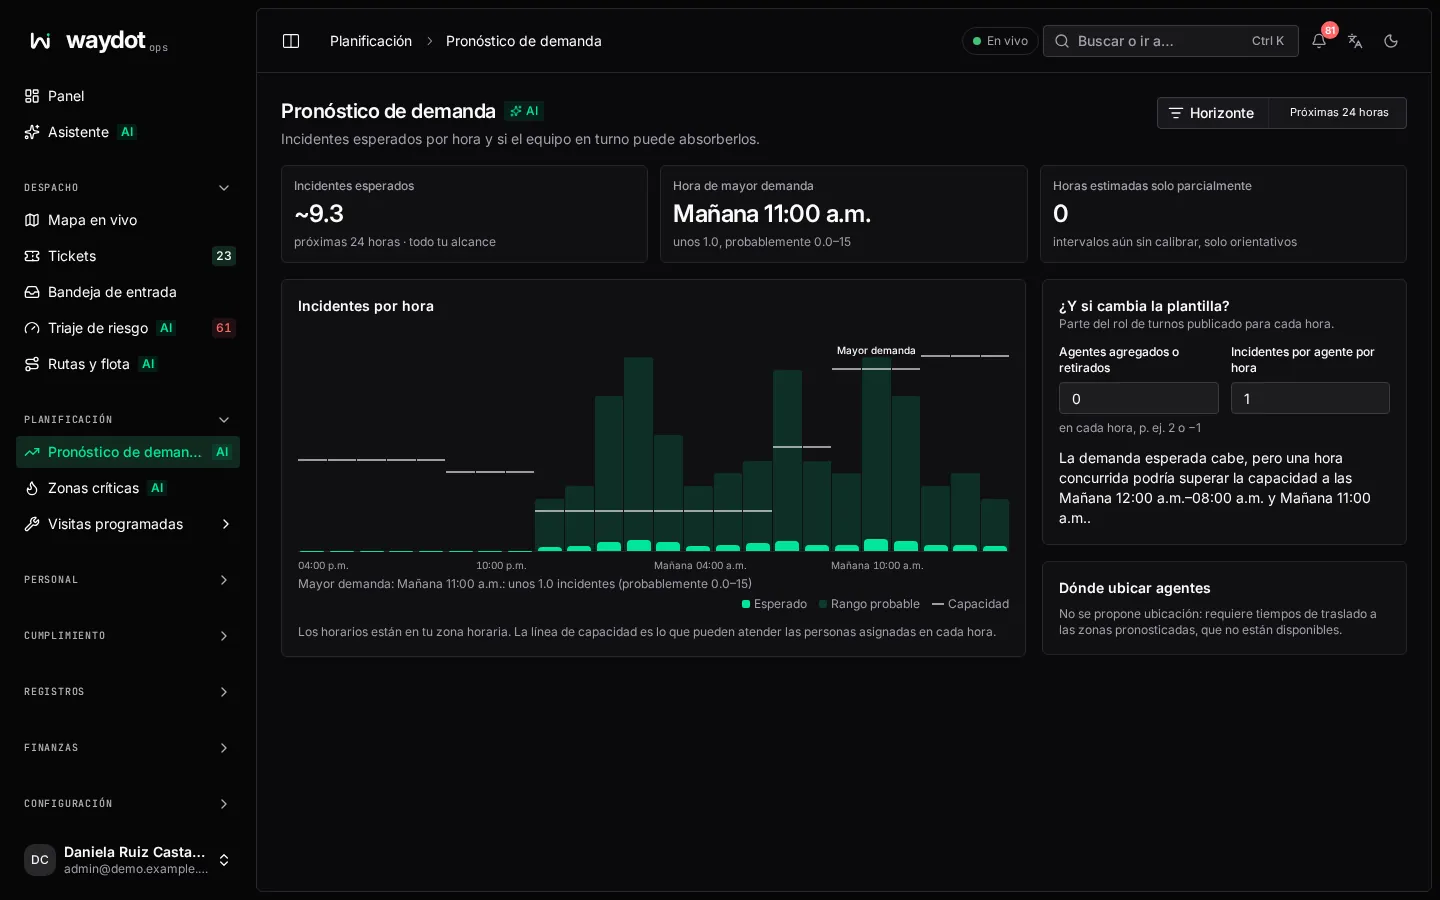
The forecast estimates how many incidents will arrive each hour and compares them with what the assigned staff can handle. Use it to decide shifts, stage agents before the work arrives or postpone scheduled visits.
Where it is: Planning → Demand forecast (AI). The Dashboard summarizes it in the Outlook card. Who sees it: people allowed to read the live operations board. Plan: Intelligence module (Pro and Enterprise).
Horizon
Choose Next 24 hours or Next 7 days. Times are in your time zone.
Forecast summary
| Item | Meaning |
|---|---|
| Expected incidents | How many are expected in the window: about 42, likely 35–50. |
| Busiest hour | The hour with the most expected incidents. |
| Hours only partly estimated | Hours where some areas don't have enough history to estimate. |
Underneath it says whether the ranges use calibrated intervals (reliable) or intervals not yet calibrated, so indicative only.
The chart
Incidents per hour: bars are the expected count and the band the Likely range. The Capacity line is what the people assigned in each hour can handle according to the published roster. Hours Above capacity are marked.
Notices:
- Expected demand exceeds capacity at …: consider adding shifts, staging agents or deferring scheduled work.
- Expected demand fits, but a busy hour could exceed capacity at ….
- The team can absorb even the upper end of the forecast.
What if staffing changes?
Simulates changes without touching the roster. It starts from the published roster for each hour.
| Field | What it does |
|---|---|
| Agents added or removed | In every hour, for example 2 or −1. |
| Incidents per agent per hour | How many one person can handle in an hour. |
The capacity line recalculates instantly.
Where to stage agents
Sites where it's worth staging agents before the shift, each with covers N expected incidents, and together they reach 78% of expected demand (above or below the coverage target). If travel times aren't available or the model has nothing to suggest, it says so.
Day by day
With the 7-day horizon, a table with each Day, the expected incidents and the Hours over capacity.
No forecast
There isn't enough recent activity to project demand in your scope: the model needs ticket history in your territories. Figures are advisory.