

English
Quality results
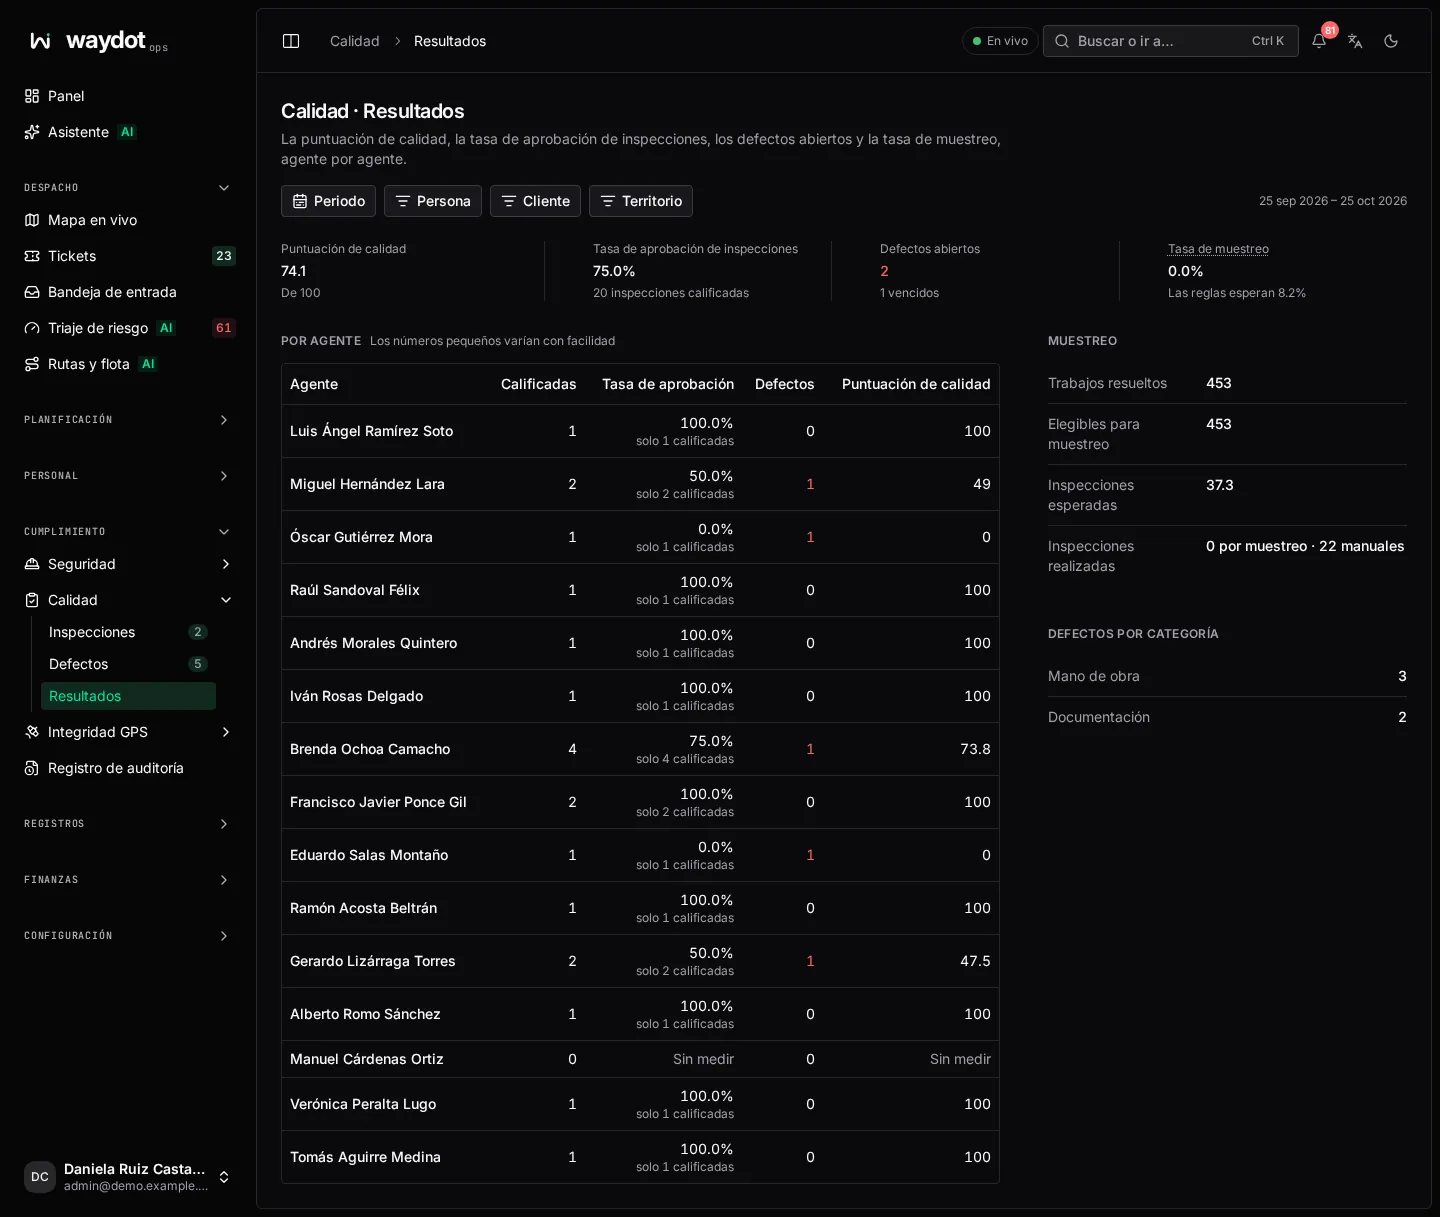
Results summarizes the period's quality: how the team scores, how many inspections pass, how many defects remain open and whether what the rules expect is being sampled.
Where it is: Compliance → Quality → Results. Who sees it: those who can read the quality record. Plan: Quality assurance module.
Filter by period, territory and client.
| Figure | What it measures |
|---|---|
| Quality score | Average of graded inspections, out of 100. Not measured when there are none. |
| Inspection pass rate | Share of inspections passed. |
| Open defects | Not verified, and how many are overdue. |
| Sampling rate | Share of eligible jobs that were inspected, against what the rules expect. The expectation uses today's rules, so a rule change also moves it for past jobs. |
Sampling breaks it down: Resolved jobs, Eligible for sampling, Expected inspections and Inspections done (N sampled · M manual).
By agent: Graded inspections, Pass rate and Defects per technician. Small numbers swing easily: an agent with few inspections can look very good or very bad from a single one.
Defects by category shows where problems concentrate (workmanship, materials…).